


Analytics in Ocamba - measure, monitor, analyze and manage
In analyzing a large amount of data in the development of marketing strategies, Ocamba is a reliable partner for several reasons. The main reason lies in the ability to serve ads to users based on their preferences, which are obtained by monitoring and pulling in dozens of different custom user data parameters.
Monday, Nov 15, 2021 / How to

Introduction
In the past, when creating a marketing strategy, it did not take too much effort to choose an adequate approach and place it in the media. It all came down to renting online space in seconds or minutes on some media and creating an advertisement for it. You would address a large group of people with the same ad hoping that it will provide you with planned results.
With the beginning of the use of the Internet for marketing purposes, both developers and marketers realized that there were new advertising opportunities. The rapid development of smart devices has led to new opportunities for advertising online since it means more data you can collect about your end-users.
Today, in the modern world, displaying ads is not easy at all. The competition has never been stronger, both in terms of money and budget invested in advertising campaigns and the increased number of competitors in the market.
Only a few years have passed from the lease of banners on sites by advertisers to the process known today as Ad Serving, and with the help of machine learning, the end of the development of this industry in the online world is not in sight.
Although the increased amount of data we can get from users means nothing if we cannot adequately interpret that data, with the help of the tools offered by Ocamba, we can do a straightforward analysis of them. Data analysis is a process that completely replaces manual monitoring of campaign parameters (which would be very hard because you would have to work with large amounts of data) and creates a unique experience in the process of monitoring and predicting end-user behaviour.
Ocamba analytics tracking
As you are already familiar with, Ocamba is a powerful tool that allows you to keep all your assets in one place - from creating marketing campaigns and their details and materials to budget planning and how they are presented to end-users. In addition to all this, Ocamba also offers the ability to track the complete analytics of your marketing campaigns.
For marketers, this means that they can understand the effectiveness of marketing campaigns, evaluate the pros and cons, and make the necessary changes to achieve the set business goals.
Ocamba’s analytics can be divided into two major categories - basic and advanced.
Ocamba’s basic analytical reports 📈
The Basic tab within Reports allows graphically viewing analytics data in the desired period, which the user can define. The graphic display can be modified depending on the wishes of the user. Data filtering is done via an icon in the lower right corner below the chart that opens fields selected or removed from the data analytics.
The following data can be selected: Requests, Served, Fill, Impression, Click, Spam click, Total click, CTR, Conversion, eCPM, Income, Expense, Revenue and Expected income.
It is possible to turn off the display of individual columns that are currently displayed by clicking on the name below the graphs. The total data shown in the table is in the last row of the table. For most data, it is the sum of all columns, while in CTR, this figure represents the result obtained as follows = total click/impression * 100.
The Campaign, Click, Country, Browser and OS reports
The difference between these reports and the Basic report mentioned in the previous part is that in the Campaign, Country, Browser, Click and OS report, there is currently no option to display the desired data graphically, but only a tabular display. However, this is something our team is working on at the moment and is expected to be featured in the upcoming releases.
The tabular display of data can be modified depending on the user’s desire to highlight specific data. Data filtering is done via an icon in the right corner that opens fields selected or removed from the data analytics.
Depending on the report selection, different data can be selected:
- This means that we can monitor parameters such as Served, Impression, Click, Spam click, Total click, CTR, Conversion, Income, Expense, Revenue, and Expected income in the Campaign report.
- Respectively in the Country report - Requests, Served, Fill, Impression, Click, Spam click, Total click, CTR, Conversion, eCPM, Income, Expense, Revenue and Expected income.
- Parameters for Browser reports - Requests, Served, Fill, Impression, Click, Spam click, Total click, CTR, Conversion, eCPM, Income, Expense, Revenue and Expected income.
- OS report parameters - Requests, Served, Fill, Impression, Click, Spam click, Total click, CTR, Conversion, eCPM, Income, Expense, Revenue and Expected income.
- And finally, in the Click report, we can see the click time and Income, Expense and Revenue from that click.
Ocamba’s advanced analytics tracking via Designer reports tool 📊
The designer reports tab provides the possibility of viewing analytical data in the desired period, which the user can define himself with the possibility of exporting it in CSV format.
To successfully generate a tabular display of analytics, the user must select the desired data from the column on the left (Dimensions and measures) and drag them to the field in the middle of the platform desktop (Drop here).
The user inserts dimensions and measures into the Drop here field in the order he wants them to be displayed in the report itself.
All selected parameters can be filtered by dragging dimensions and measures into the filters field. Then it is necessary to choose a specific value for filtering using the select option.
By clicking on the Preview button, Ocamba will generate a table with the data selected for display, which can be further exported to CSV format and saved on the device.
Ocamba currently offers to track over 15 different dimensions and 15 measures through the designer report tool.
How to use data from Ocamba’s reports?
The question is - what key information should analytics give us? To make it more convenient for you, we have divided it into five big categories.
1. Information about which communication channels bring the desired results and which do not
If you are not sure that advertising on a publisher’s site is a good idea, you can check it through a test. You can run the same campaign on multiple sites and then analyze analytics and parameters to determine which communication channels have brought you the desired results and which have not.
2. Information about the return on investment
The goal of most marketing campaigns is to return the investment and check if it has brought you any profit. Ocamba allows you to see analytics of this type by tracking different dimensions such as - clicks, shares, revenue, expenses, income.
3. Information on how end-users react and respond to your campaigns
Tracking parameters such as impressions, clicks, and desired actions can provide insight into your marketing campaigns’ end-user response and reaction.
4. Information on marketing reach expansion
Conquering new markets in which you have not done business so far is not an easy task. People from different parts of the world have different customs and cultures, which means that it is challenging to develop a marketing campaign that will appeal to everyone.
For this reason, Ocamba offers the option of serving ads to different users in different ways (by changing the image, text, etc.). If you expand to other markets and start exporting your goods and services to the same, it is a sure sign that your marketing campaign is doing exactly what you wanted.
5. Sales response information
Tracking basic sales parameters in internal documents can tell if your marketing strategy has been successful.
For example, your advertising budget was $100,000 in the third quarter, and you used that money to serve ads through Ocamba, which resulted in sales of $500,000. A comparative analysis of sales from the first and second quarters of the same year, which amounted to $250,000 and $300,000, can conclude that your advertising through Ocamba was more than successful.
Conclusion
Determining the success of a marketing campaign is a highly complex process. Even though there are more Tb data in circulation in the world every second, monitoring this data has never been easier, primarily if you determine the parameters that need to be observed in time.
Additionally, the amount of data left on the Internet is rapidly increasing, meaning it is possible to target user with highly focused ads and drive positive outcomes for your marketing campaigns. This means that you can track your end-users behaviour every step of the way - from initial interest to final purchase, all while still maintaining end-user data protected.
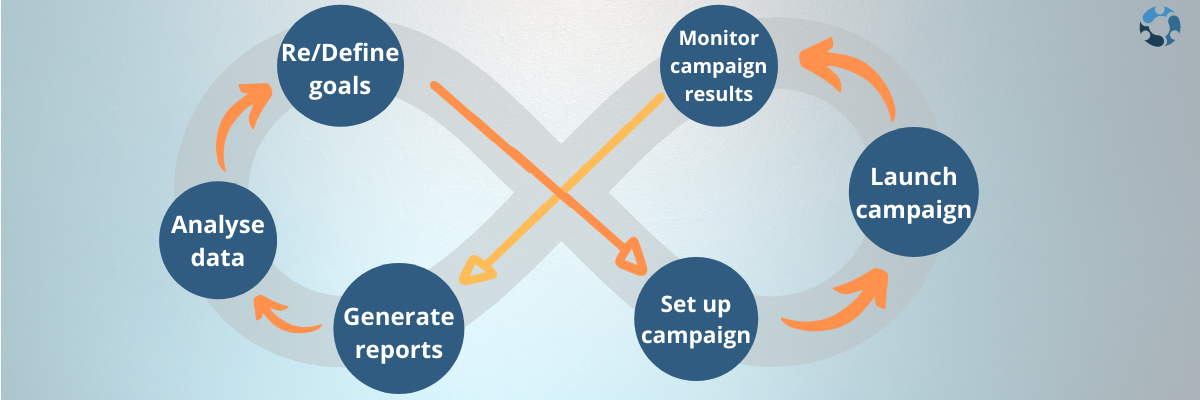
As you have read above, Ocamba tracks billions of different data from your end-users. Rather than leaving it scattered in various formats throughout the platform, Ocamba structures it in meaningful reports and graphic previews. This allows marketers to closely measure and monitor every campaign they put out there and reshape them according to the analytics provided.
Good luck with your campaigns, and do not hesitate to contact the Ocamba team for any help you may need alongside!
About
Combining advanced technologies and a hard-working team with over 15 years of experience in the field, we give our customer's multiple possibilities to increase revenue, minimize fraud and encounter both the demand and supply side of the process through our smart RTB system.


 www.ocamba.com
Copyright © Del Systems
×![]()